SASS Platform for Road Design & Quality Control
Crafted user-friendly UI/UX to help engineers and inspectors manage, annotate, and evaluate pavement data effortlessly
PAVE (Pavement Automated Visual Evaluator) is a SaaS platform designed to revolutionize how engineers and municipalities assess pavement conditions and design better, longer-lasting roads.
By combining AI-driven visual analysis with a user-friendly interface, PAVE enables users to upload data, process images, evaluate pavement quality, and monitor progress — all in one streamlined dashboard.
I joined this project as a UI/UX designer and front-end developer, responsible for designing the user experience and building a responsive dashboard that serves both technical and non-technical stakeholders.
The biggest challenge was to present complex AI output in an intuitive and actionable way while keeping the workflow efficient for large-scale road projects.
Problem Statement
Road design and maintenance is traditionally labor-intensive, involving thousands of images, spreadsheets, and subjective quality assessments.
The goal of PAVE was to:
Automate the analysis using AI and computer vision.
Deliver reliable, interpretable insights through a web interface.
Reduce errors, save time, and improve overall road quality.
However, the AI outputs were highly technical and data-dense, which made it difficult for non-technical users to understand or act on them without a thoughtful UX layer.
My Role
I was responsible for the following:
Understanding the AI pipeline and identifying what data needed to surface in the UI.
Mapping out user flows for project creation, dataset upload, image review, annotation verification, and progress tracking.
Designing high-fidelity mockups and interactive prototypes in Figma.
Ensuring consistency, responsiveness, and accessibility across the app.
I collaborated closely with:
Data Scientists, Project Managers and Backend Developers
Discovery
We started with a discovery phase to: Interview domain experts in road design and QC engineers. Map the existing workflow and identify pain points. Analyze competitor tools and industry standards.
Design
I then designed wireframes and prototypes that went through several iterations based on feedback. Key design decisions included: Dark Theme with Vibrant Highlights: To reduce eye strain during long sessions while maintaining good contrast and focus. ats and directories for exporting results.
Development
After finalizing the designs, I developed the front-end with: React + TypeScript for component-based architecture. TailwindCSS for clean, maintainable styling. Integrated with REST APIs provided by the backend team. Implemented interactive controls (zoom, pan, toggle annotations) and responsive layouts for various screen sizes.
Design Goals
🎯 Simplify Complexity
Make it easy for users to upload data, review annotated images, and understand progress — despite the technical complexity of the AI system.
🎯 Optimize for Scale
The system needed to handle thousands of images and multiple projects simultaneously without slowing down or overwhelming users.
🎯 Build Trust
Ensure users could clearly see what the AI detected, verify it against the original data, and feel confident about the results.
🎯 Enhance Productivity
Enable teams to work faster, with fewer errors and less manual effort, through intuitive design and thoughtful workflows.

Key Features
📁 Project Setup
Users could upload datasets, include/exclude subfolders, and organize projects intuitively.
A hierarchical file navigator allowed them to maintain clear folder structures and manage large datasets effectively.
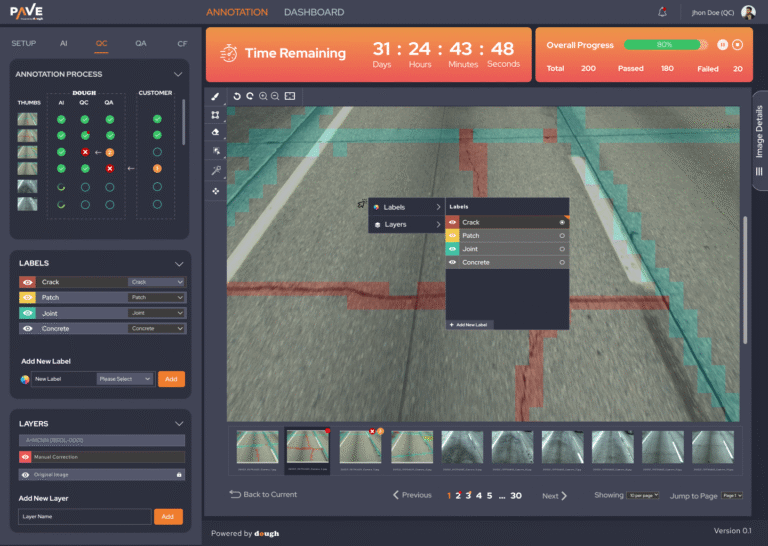
🖼️ Image Annotation
The core feature:
Automatically detect and highlight cracks and other defects in pavement images.
Overlay colored masks on the images with zoom and pan functionality.
Compare AI-detected results with original images for QC.
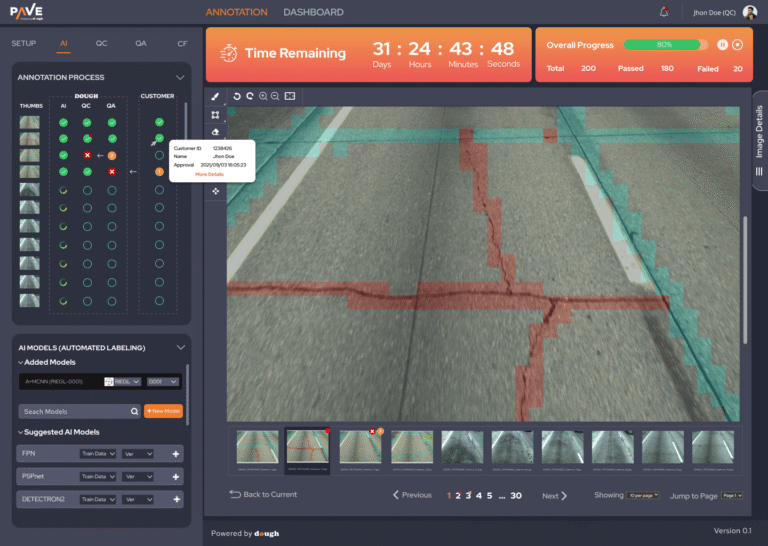
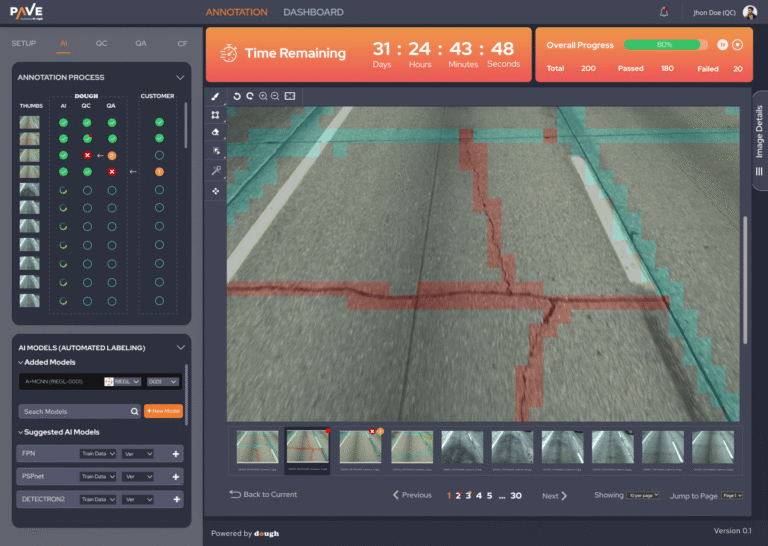
⏳ Progress Tracking
A visually prominent countdown timer to keep projects on schedule.
Progress bar and statistics showing:
Total images → Passed → Failed → Overall completion %
Pagination and jump-to-page features for fast navigation.
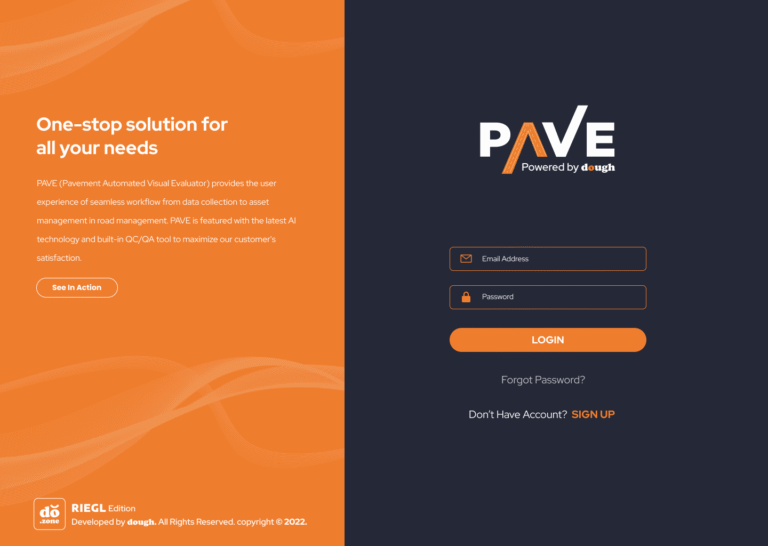
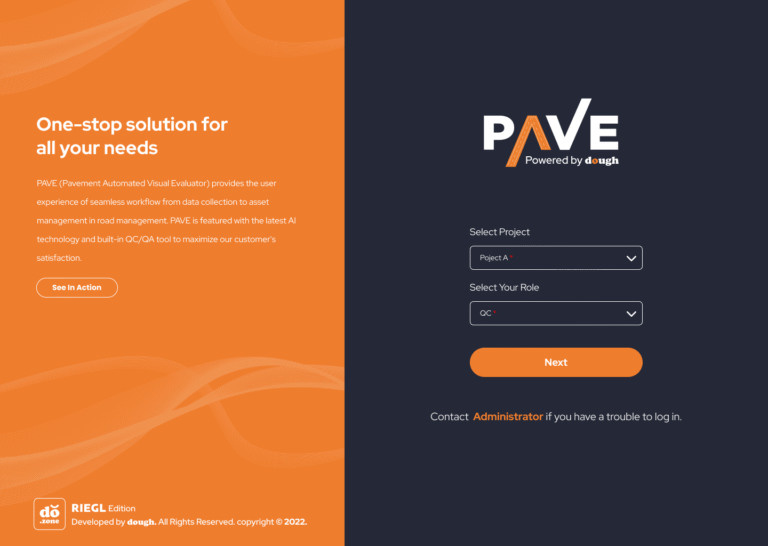
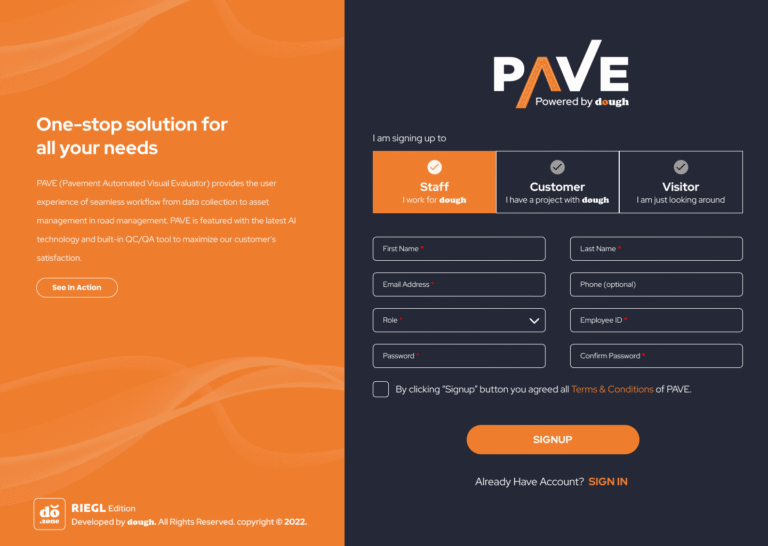
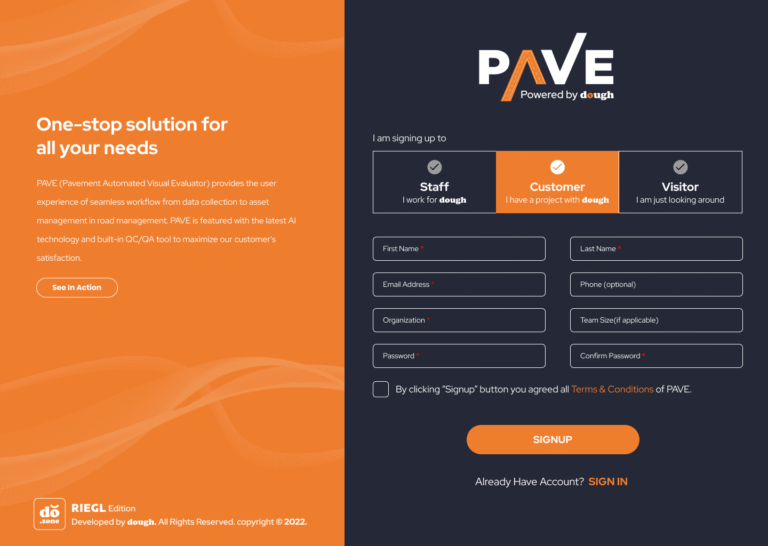
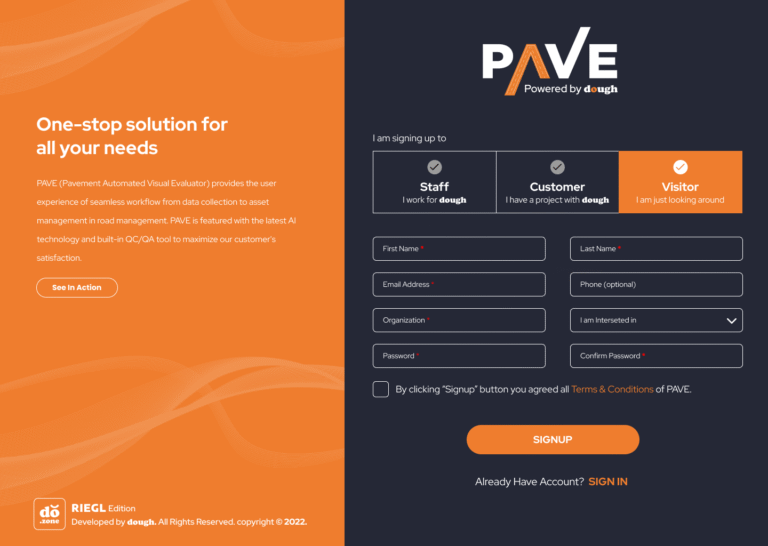
🔐 Authentication & Security
Designed a welcoming login and registration experience.
Integrated role-based access control for engineers, QC, and admins.


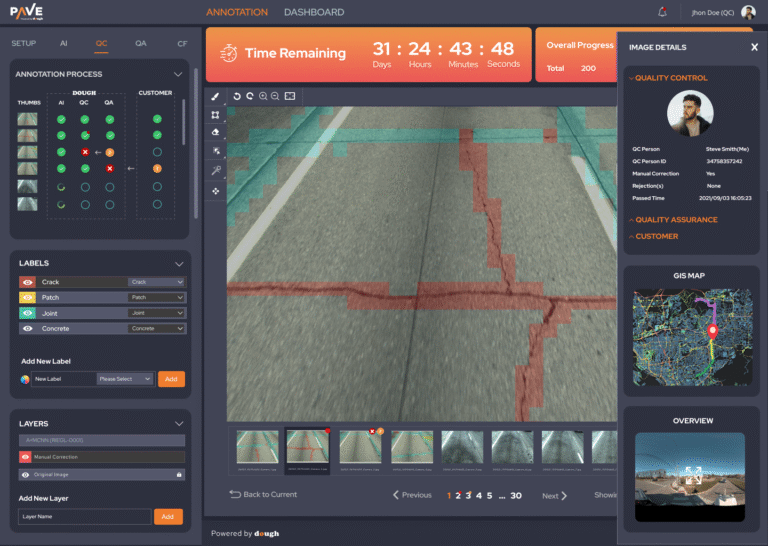


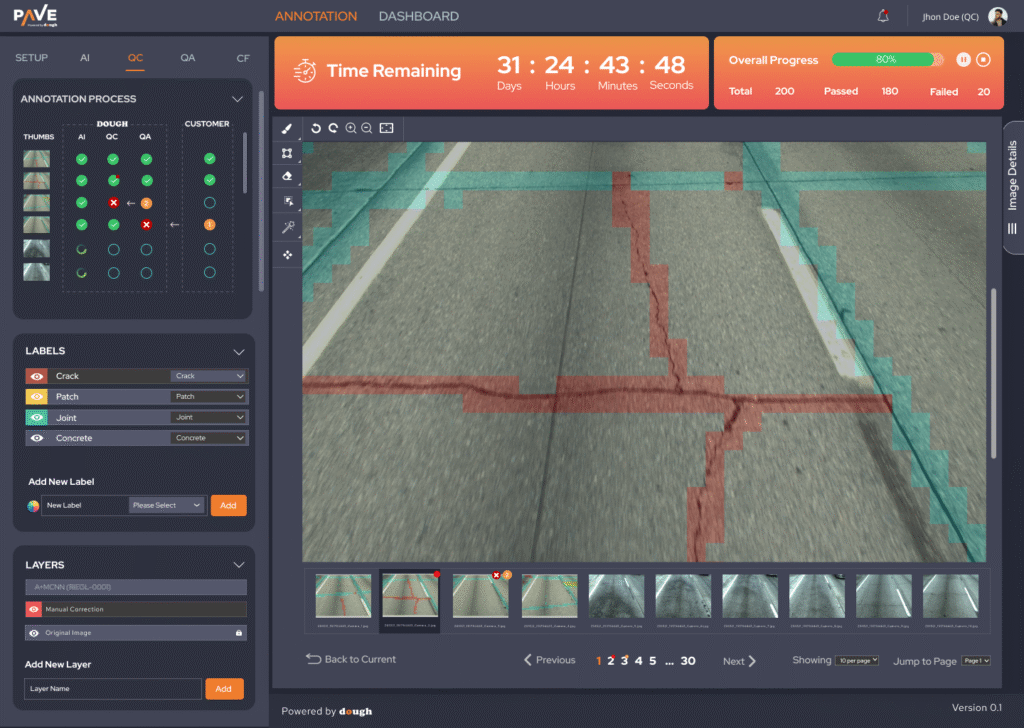
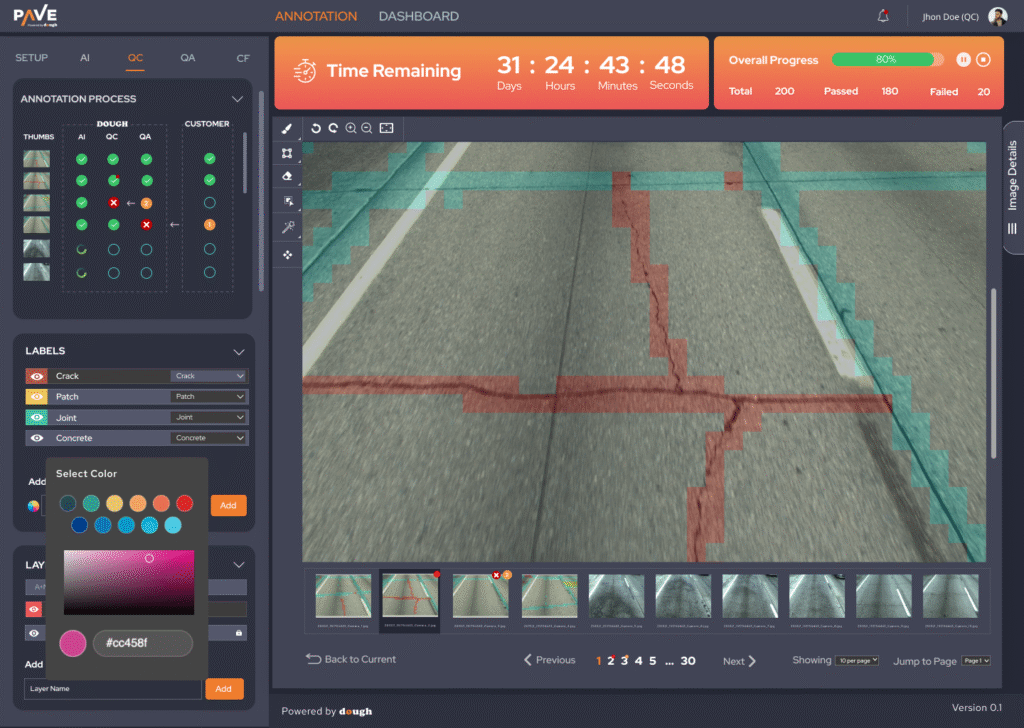
Key Features Designed
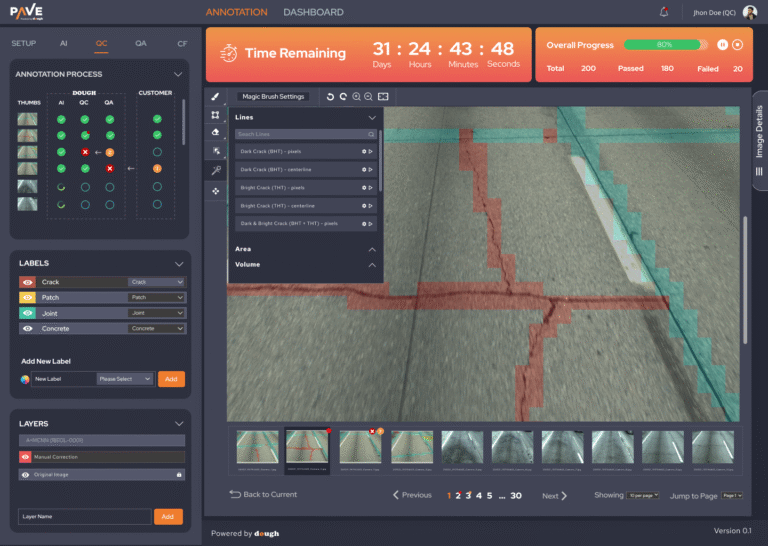
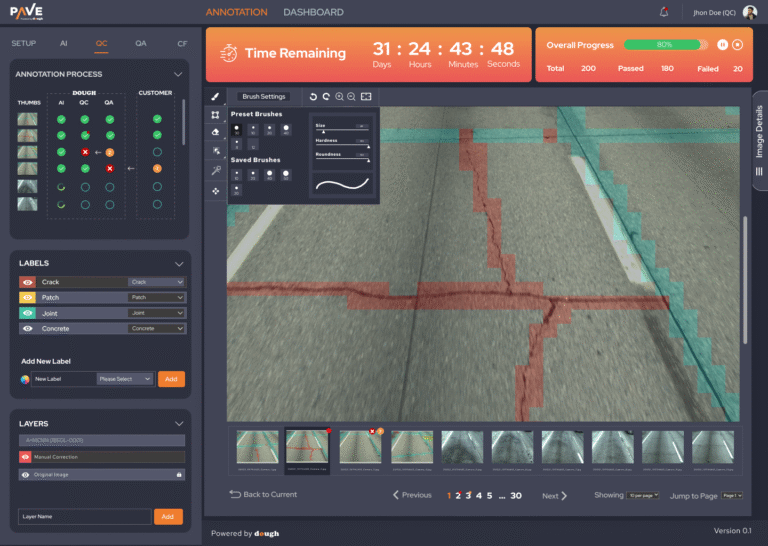
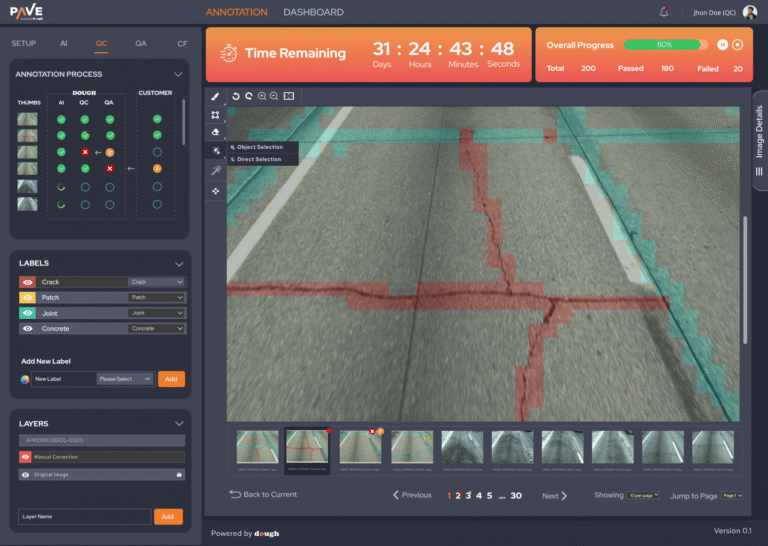
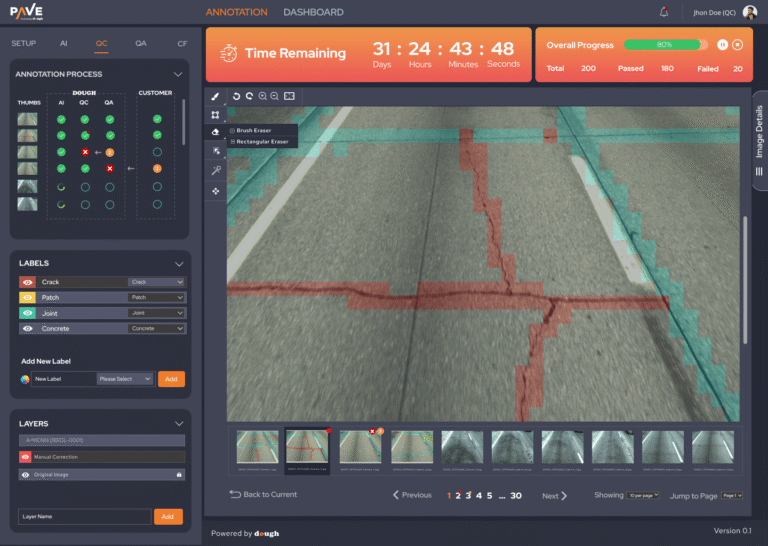
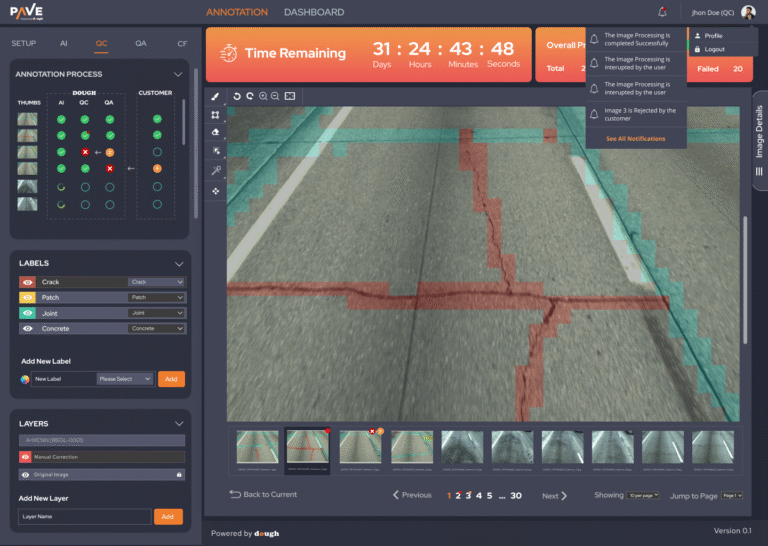
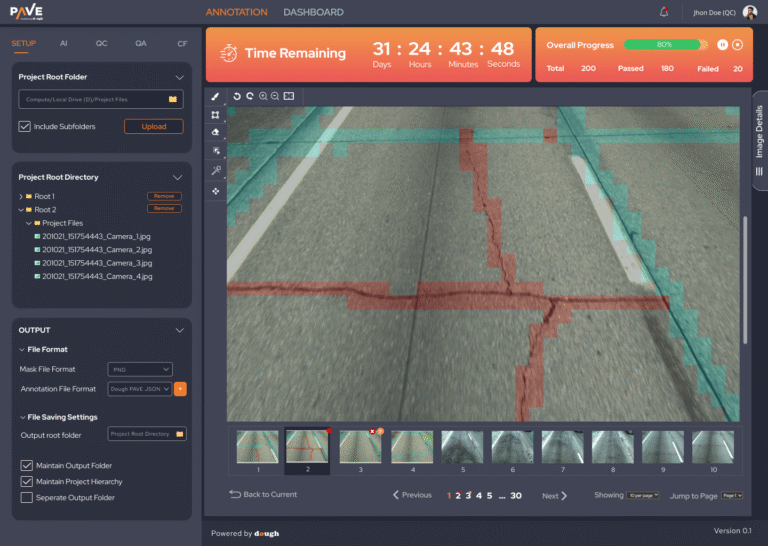
🧮 Dashboard & Annotation Workspace
The core feature of PAVE is a visual annotation panel used to detect and mark road cracks using AI. The interface includes:
Time Tracker: Displays remaining project time in a visually urgent format.
Progress Overview: Animated bar shows pass/fail results with total images processed.
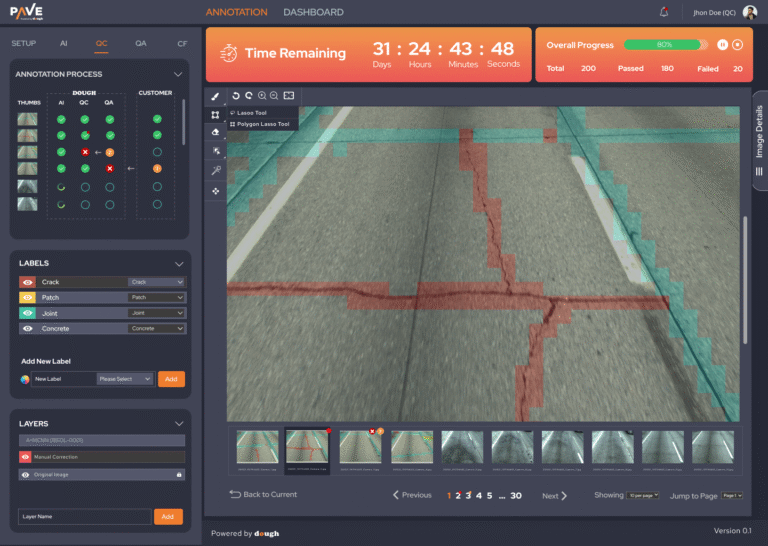
Image Navigation: Bottom gallery allows batch navigation through image sets.
Annotation Tools: Users can draw, zoom, pan, and view AI-detected overlays.
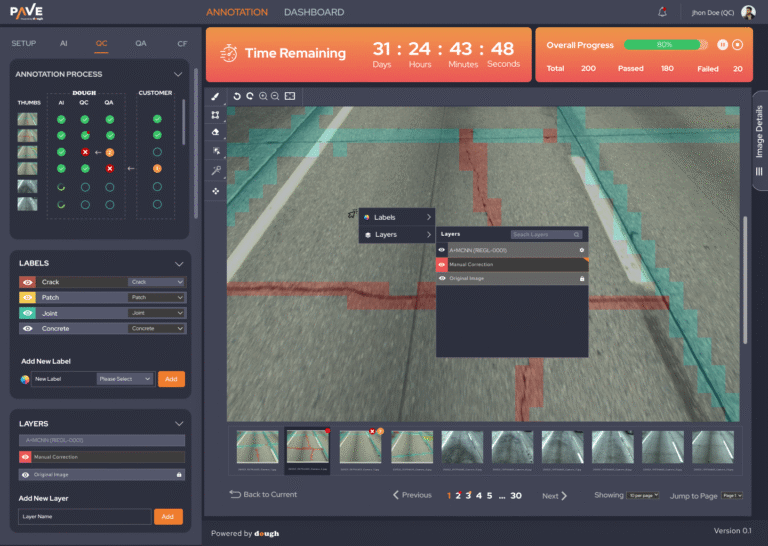
🧾 File & Project Management
Nested Folder Import: Easily handle 1000s of image files with subfolders
Output Settings: Export annotations in PNG or PAVE-JSON format
Maintain Project Hierarchy: Output respects original file structure
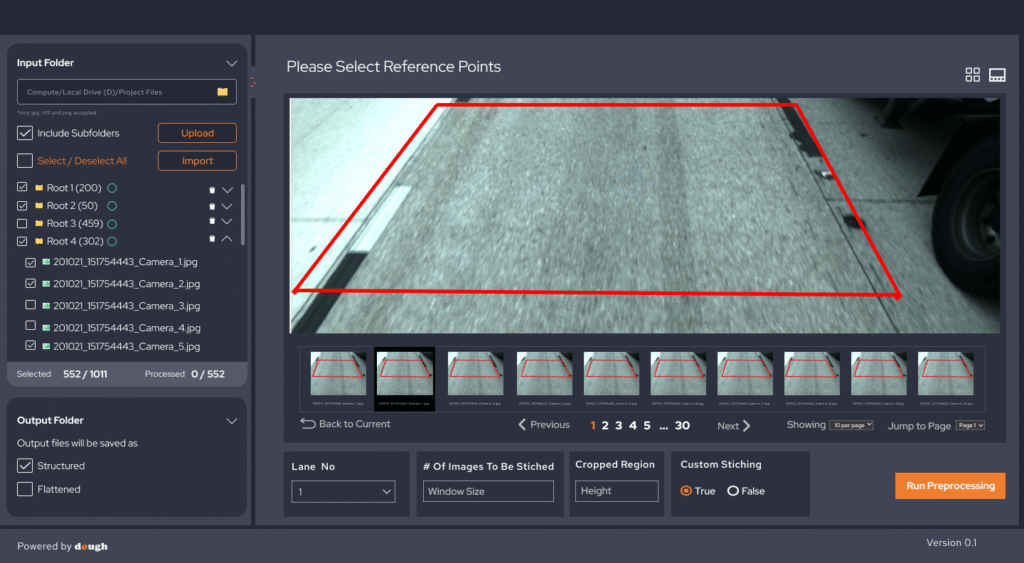
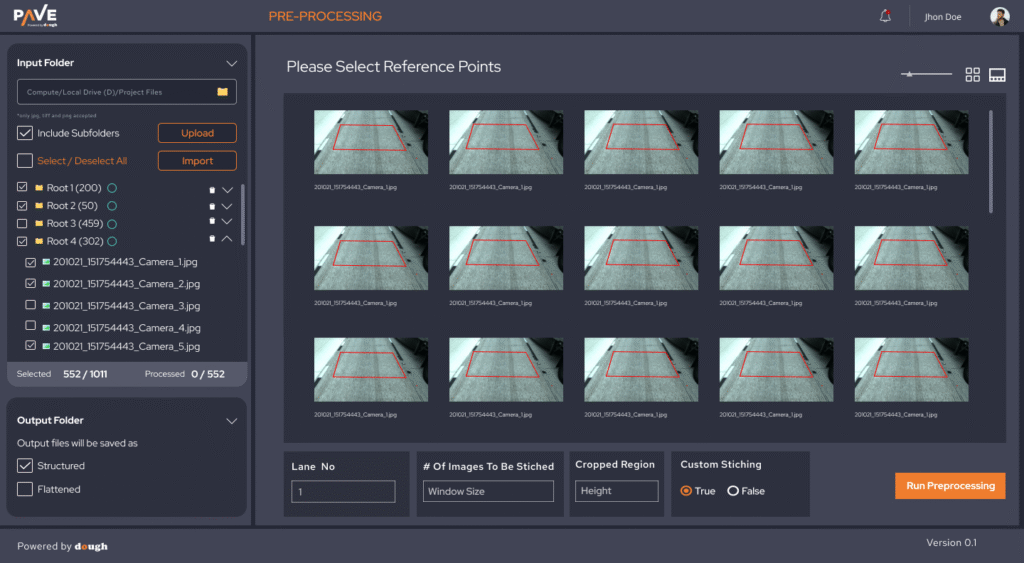
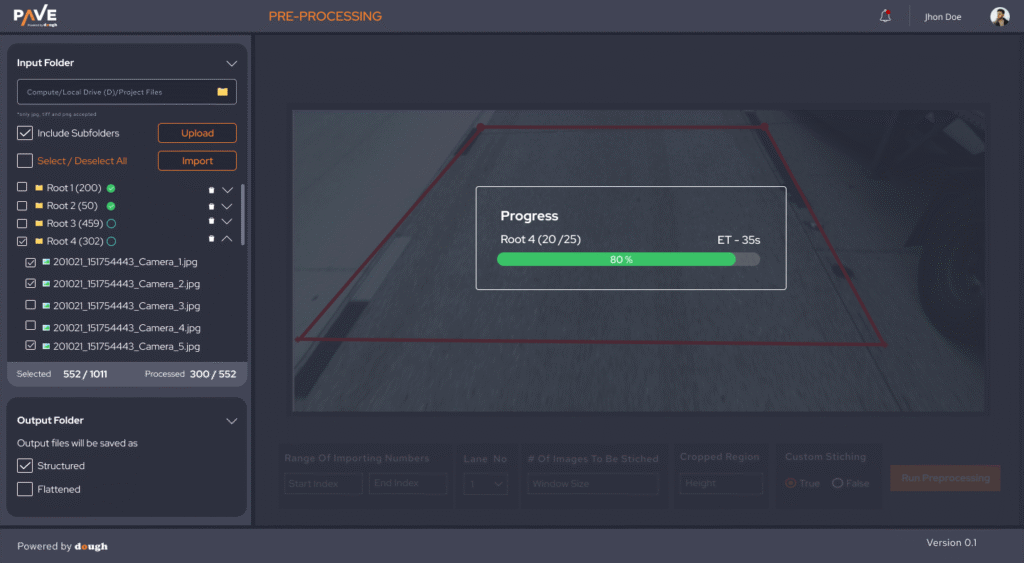
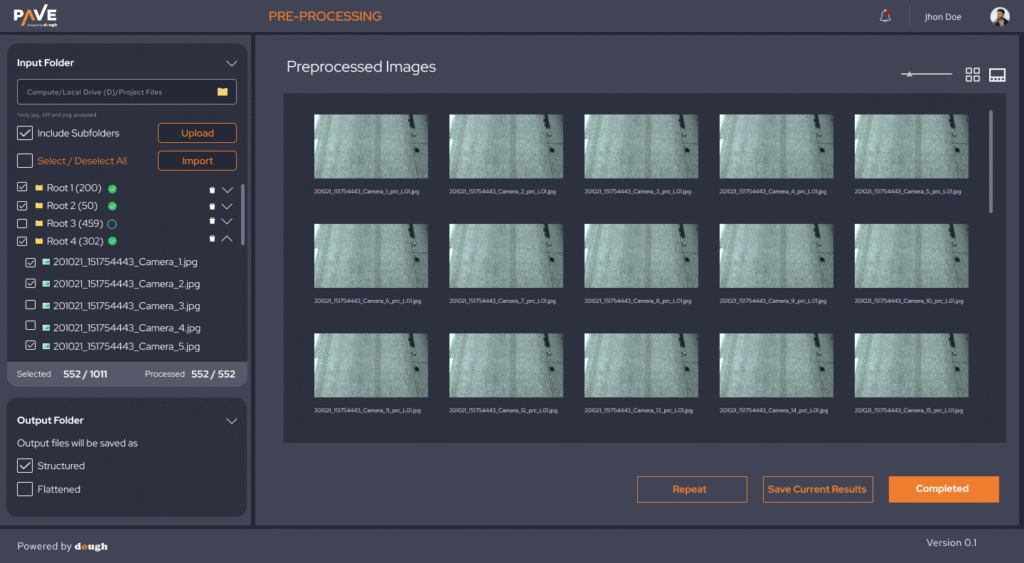
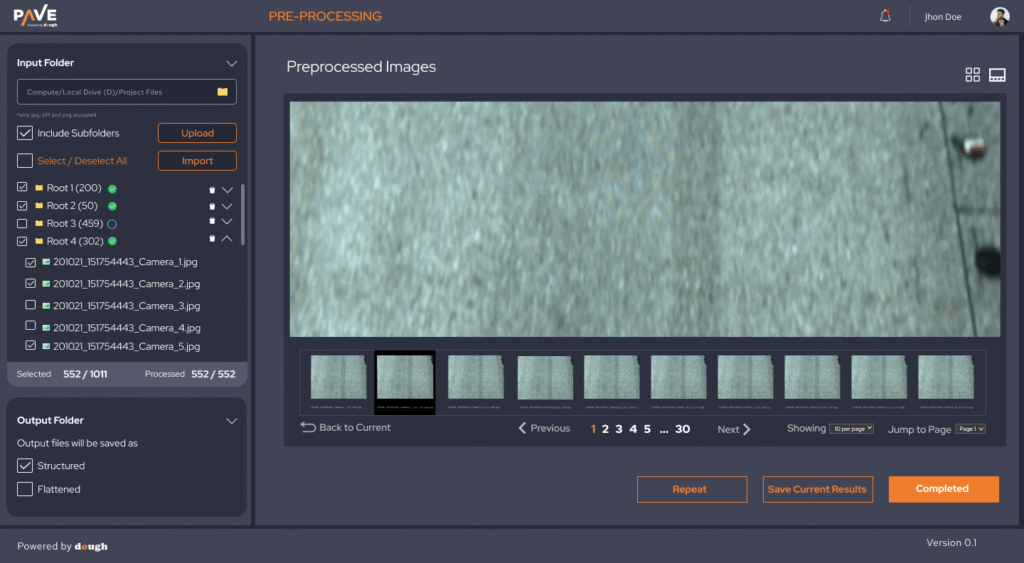
🧰 Preprocessing Panel
A critical stage in data preparation, the preprocessing interface lets users stitch, crop, and validate raw images before passing them to AI.
Key UI elements:
Image Reference Selection with red polygon outlines
Batch Navigation with Selectable Roots
Stitching Options like Lane No, Crop Size, and Custom Parameters
Run Preprocessing Button with structured and flattened output toggles
🧠 Learnings
Designing for AI-powered tools requires balancing control and automation—users want to override the system while still trusting its intelligence.
Performance matters in image-heavy tools. We optimized UI responsiveness during deep zoom/pan.
Clarity wins: Even highly technical platforms should feel familiar, not overwhelming.


🏁 Final Thoughts
This project deepened my expertise in designing complex data platforms, especially where AI meets real-world infrastructure. It’s a strong example of how thoughtful UI/UX can turn raw data into action—and complexity into clarity.
Let's Create Something Amazing Together
Ready to transform your ideas into reality? I’m here to help you build exceptional digital experiences.